Our science
No black boxes. No made-up scores.
Every number in ExaHealth can be traced to a published model, a recognized clinical guideline, or your own baseline — and the app shows you which.
140+
Biomarkers analyzed
14
Health dimensions
50+
Clinical studies referenced
22
Medical guidelines integrated
Methodology
From raw report to Health Score, in five steps
Collect
Lab reports, wearable vitals and medical imaging — gathered from photos, WhatsApp, Gmail, Apple Health and ABDM.
Analyze
Every value is mapped to evidence-based reference ranges from peer-reviewed studies and clinical guidelines.
Personalize
Ranges adjust for your age, sex, and life stage — pregnancy, menopause, senior health, chronic conditions.
Score
Each dimension is scored with clinically weighted markers — the most significant markers count the most.
Guide
Clear insights on what’s working and what needs attention — to discuss with your doctor, never to replace them.
The reasoning engine
Not a filing cabinet — a reasoning engine
It captures everything, reasons across your conditions, grades every finding and tells you what to monitor next — then hands you a report your doctor can read in a minute.
Captures everything
Every lab, vital, medicine and scan — one timeline
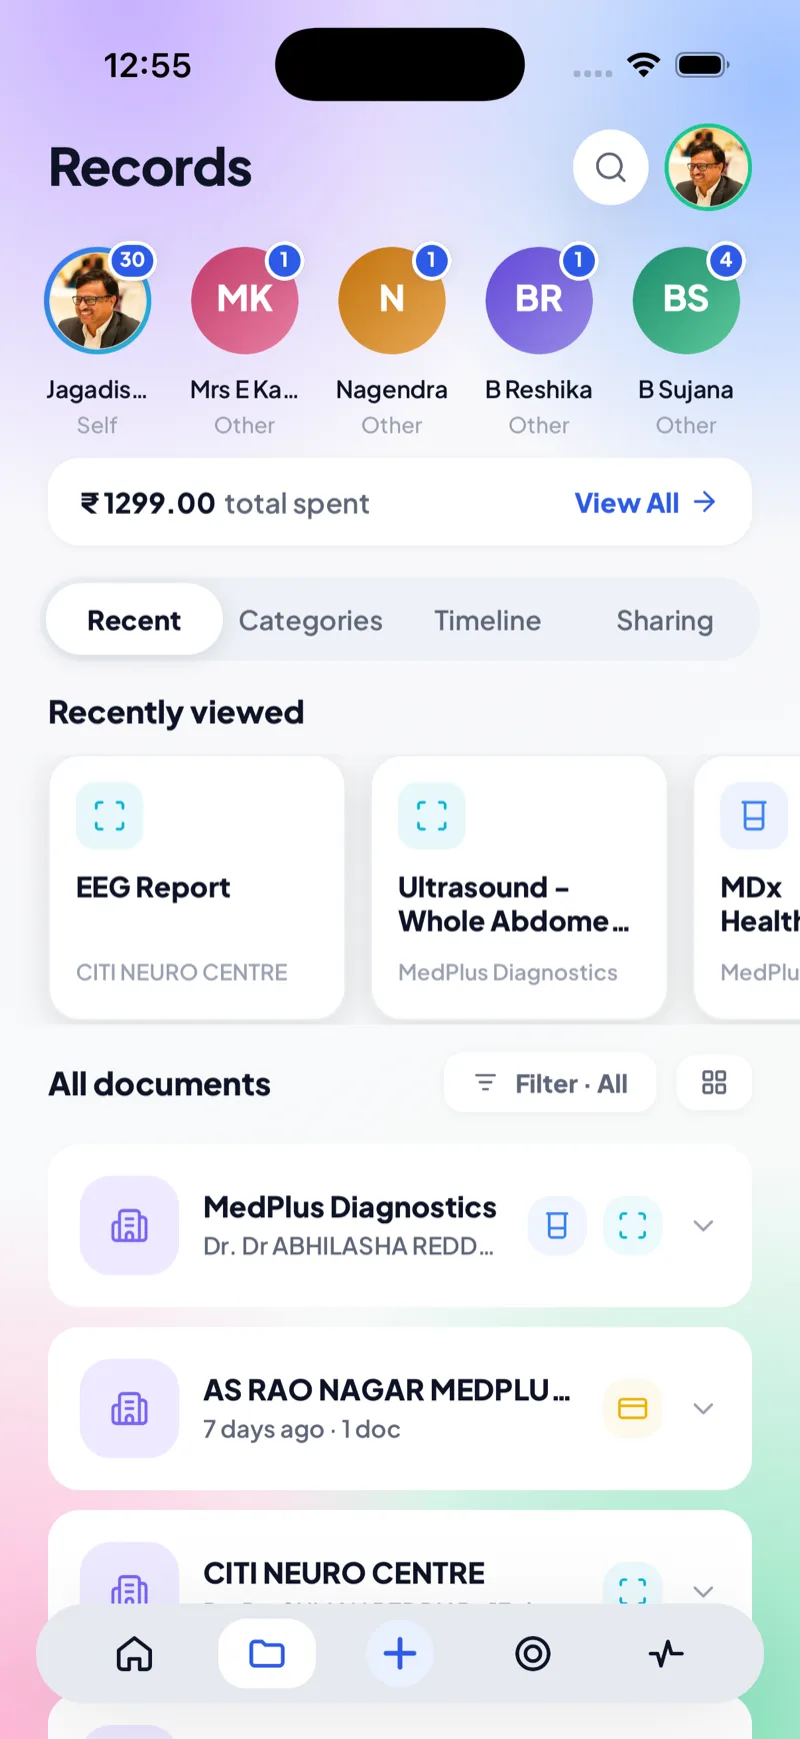
Lab reports, vital signs, medications, prescriptions and imaging are read and filed automatically — for you and every family member — so nothing is stranded in a WhatsApp thread or a drawer. No typing, no data entry.
- Labs · vitals · medications · imaging · wearables
- Auto-filed to the right family member
- Every value kept as a datapoint over time
Multi-condition reasoning
It manages conditions together — not in silos
Conditions are added from your medications, lab results and imaging, then reasoned about as a whole. High blood pressure on its own is a different picture once blood sugar joins it — so ExaHealth surfaces the related conditions to watch for, and marks the ones you’ve brought under control as Managed.
- Added from medications, labs & imaging
- Comorbidities analysed together, not one by one
- Related conditions to watch — and “Managed” ones flagged
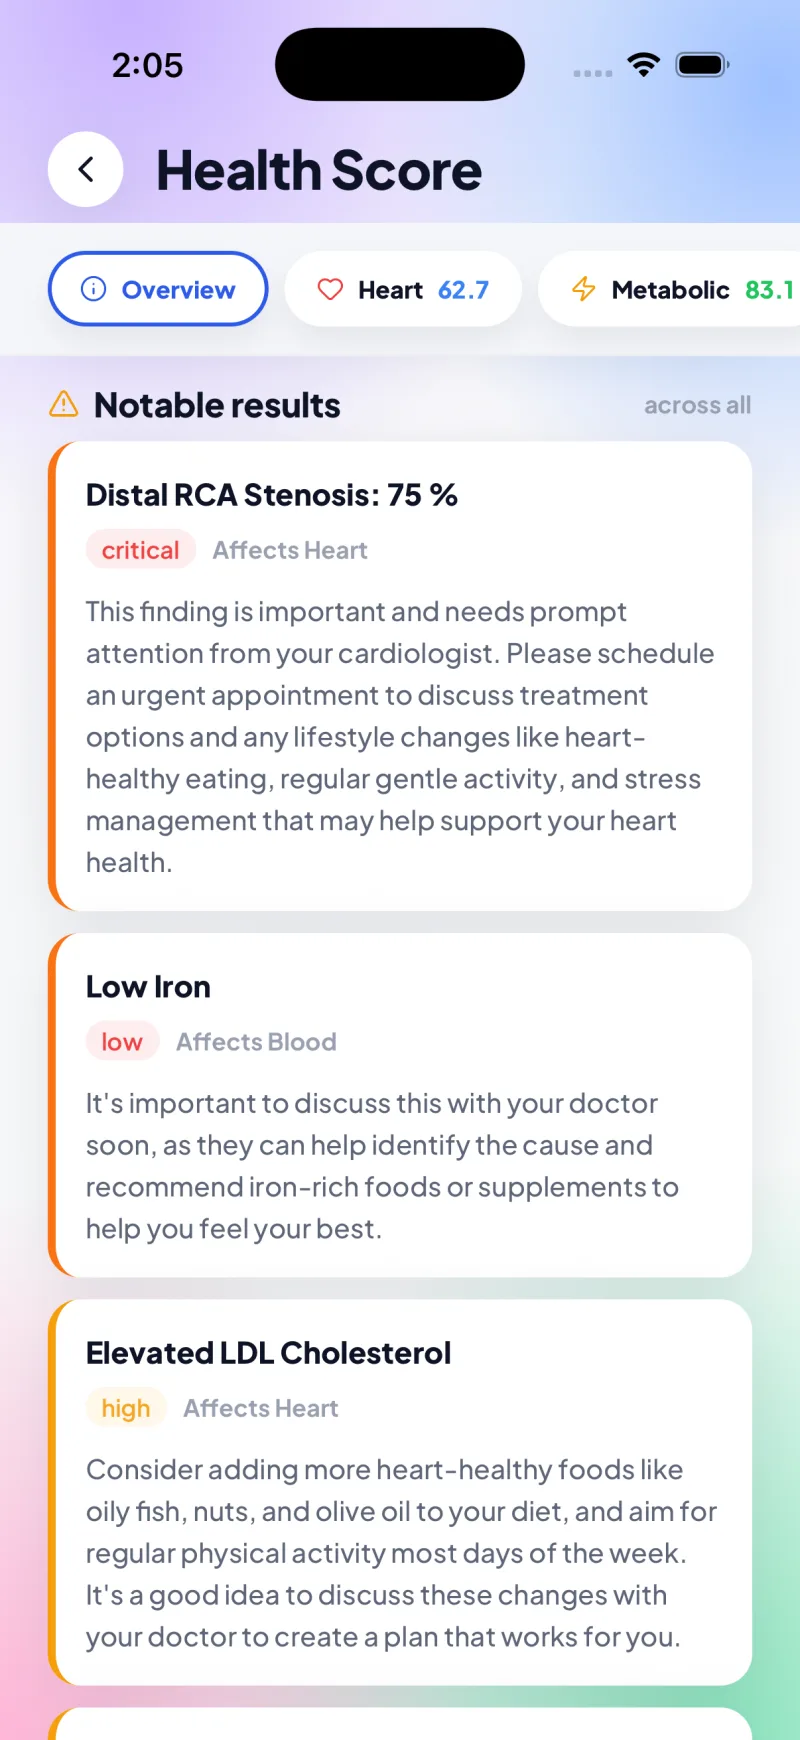
Severity engine
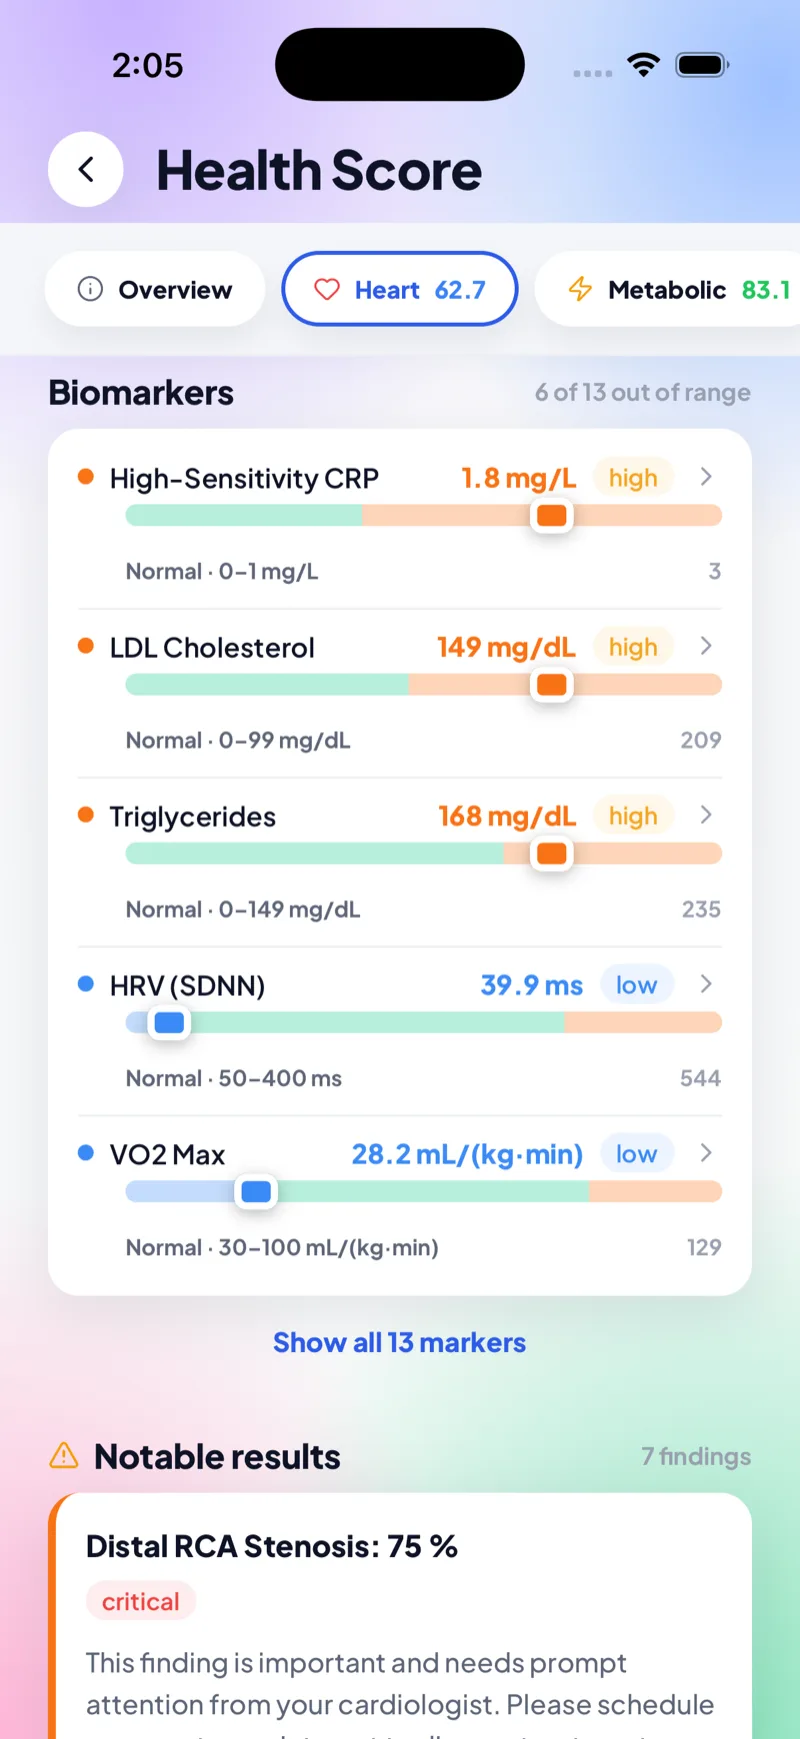
Every finding graded — even from a scan
From a bloodwork flag to a 75% coronary stenosis inside an angiography report, each value is classified critical → normal against curated ranges. When it can’t classify a value safely, it says “no assessment” instead of guessing.
- Critical · high · borderline · normal tiers
- Labs, vitals and imaging findings
- Fails closed — honesty over coverage
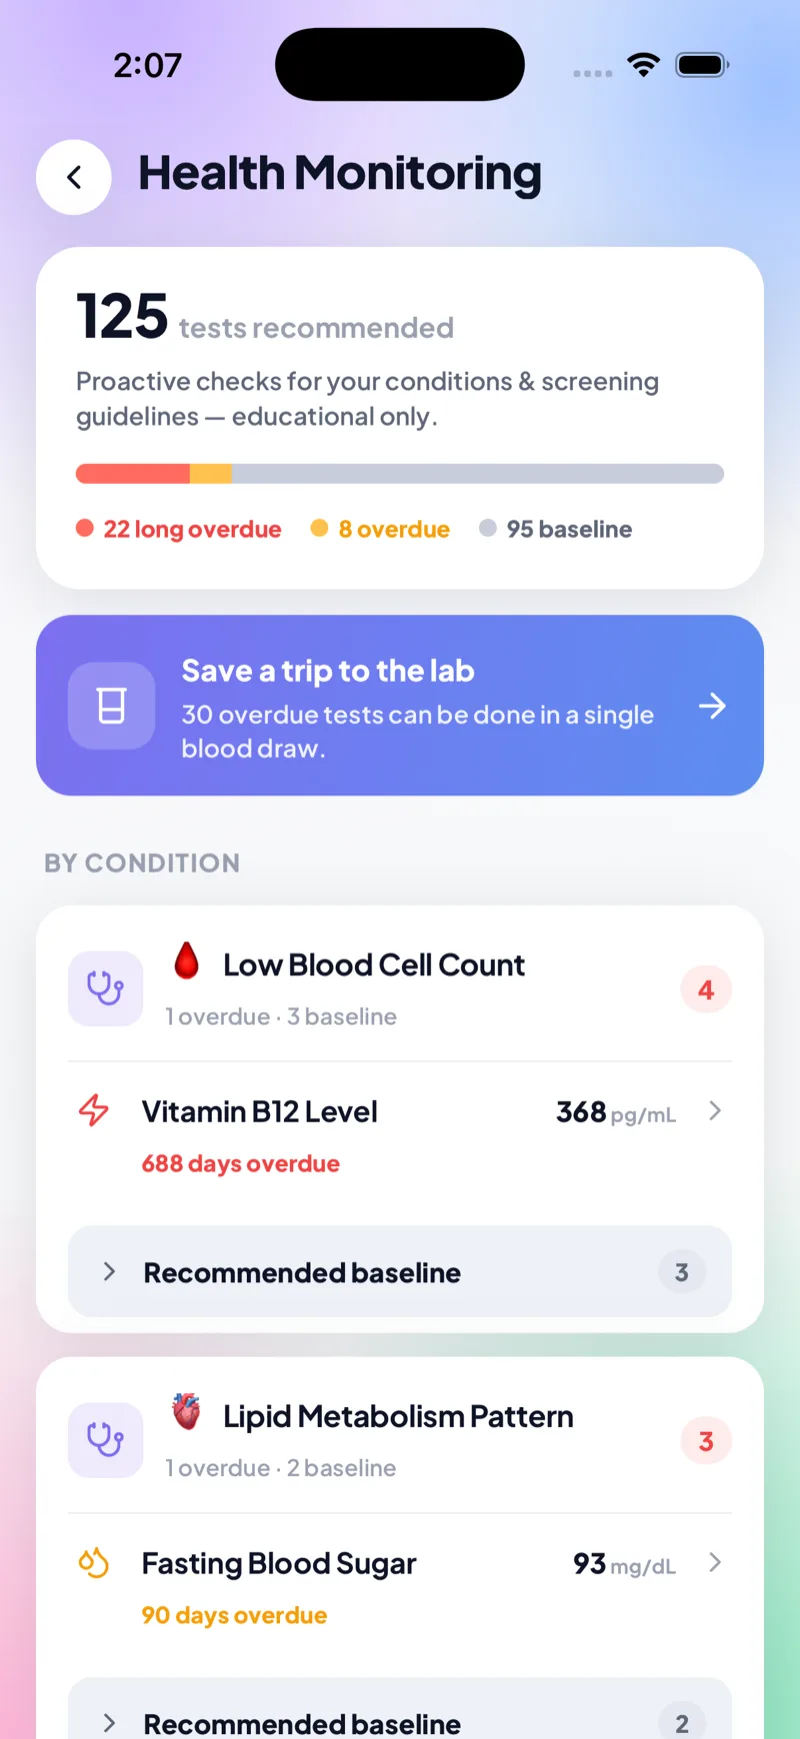
Proactive monitoring
It tells you what to check next, and why
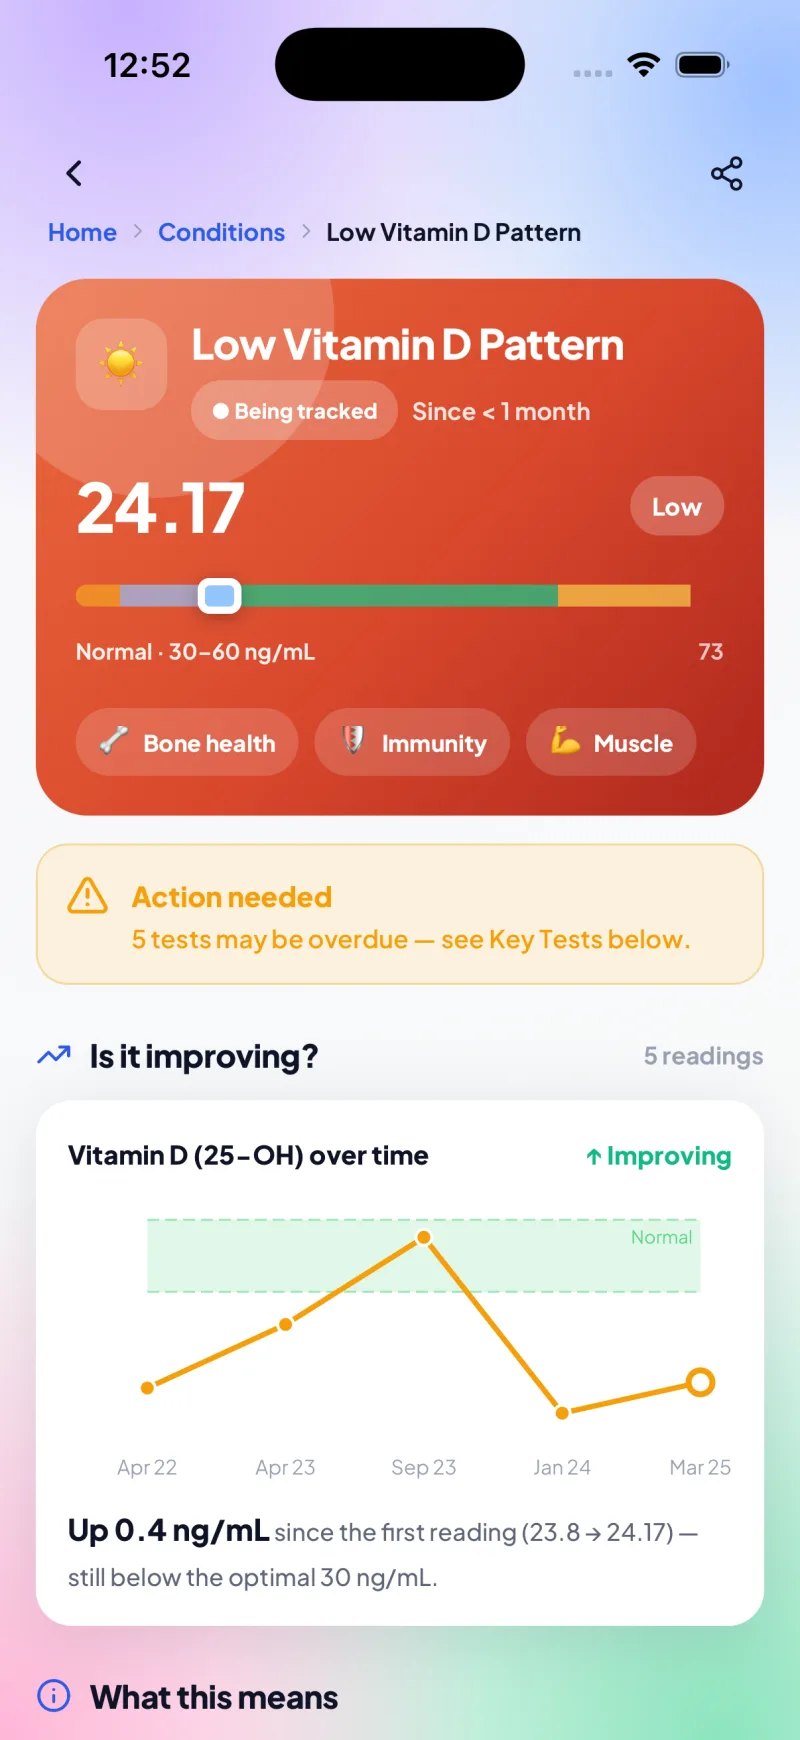
For every condition, ExaHealth knows which further tests and vitals to monitor and on what cadence — flagging what’s overdue to the day and grouping tests that can be drawn together. Proactive and guideline-based, not reactive.
- The exact tests & vitals to monitor per condition
- Overdue flagged to the day
- Batched into a single blood draw
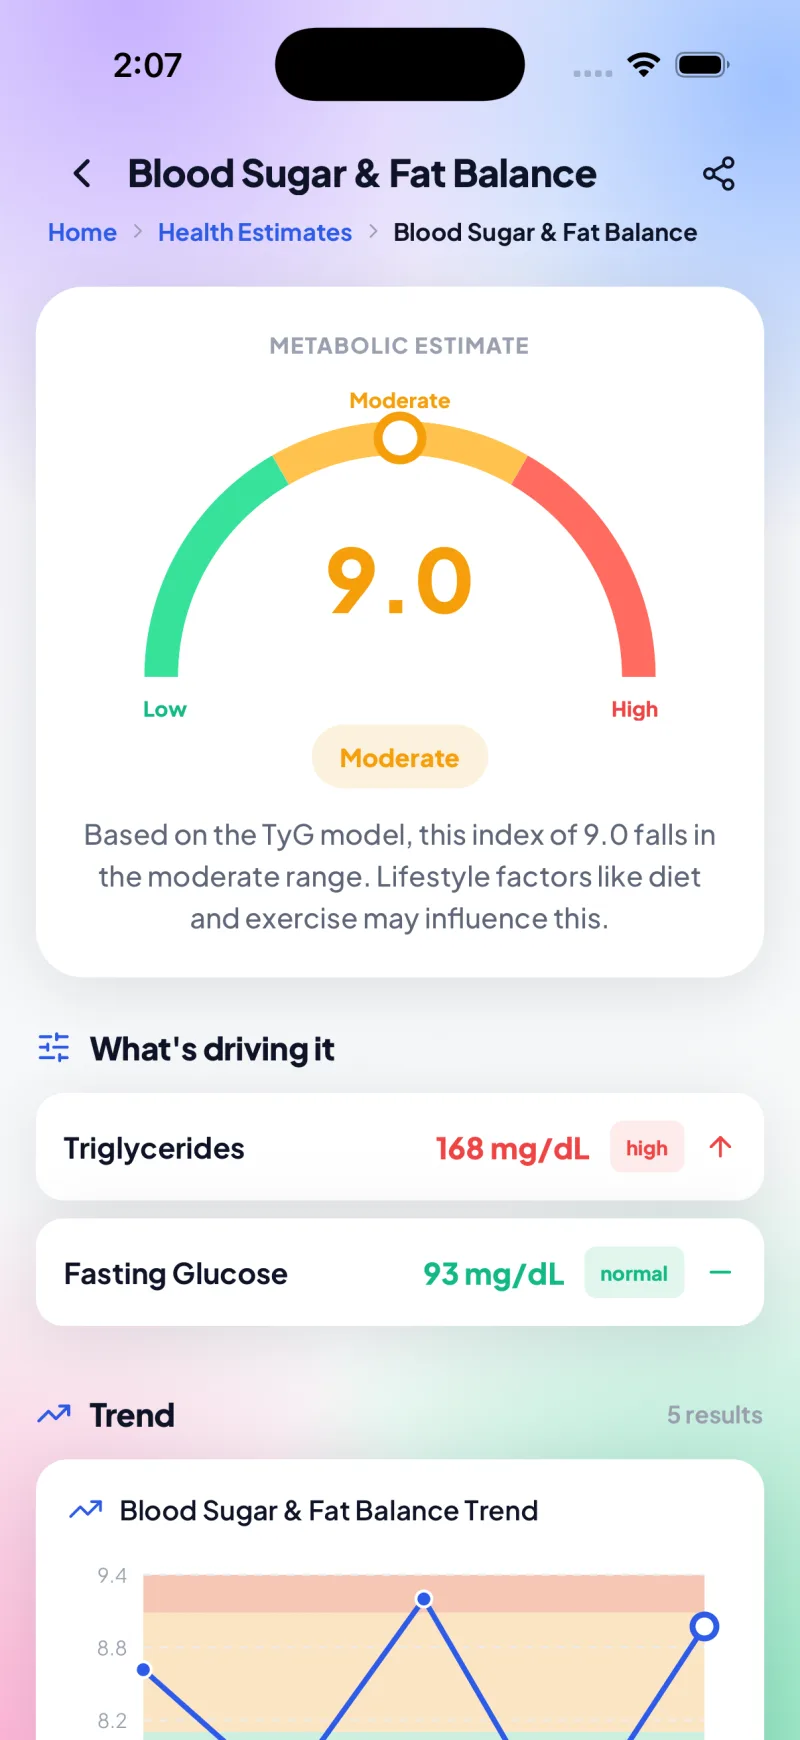
A panel of estimates
Not one score — a panel of validated estimates
From the same labs, ExaHealth computes a set of science-backed estimates — each on a published research model, adjusted for your age, sex and conditions, with the exact markers driving it shown. Educational, never a diagnosis.
- Blood Sugar & Fat Balance — TyG insulin-resistance index
- Metabolic Syndrome — clustered cardiometabolic risk
- Liver Scarring Risk — FIB-4 fibrosis estimate
- Biological Age — PhenoAge over your bloodwork
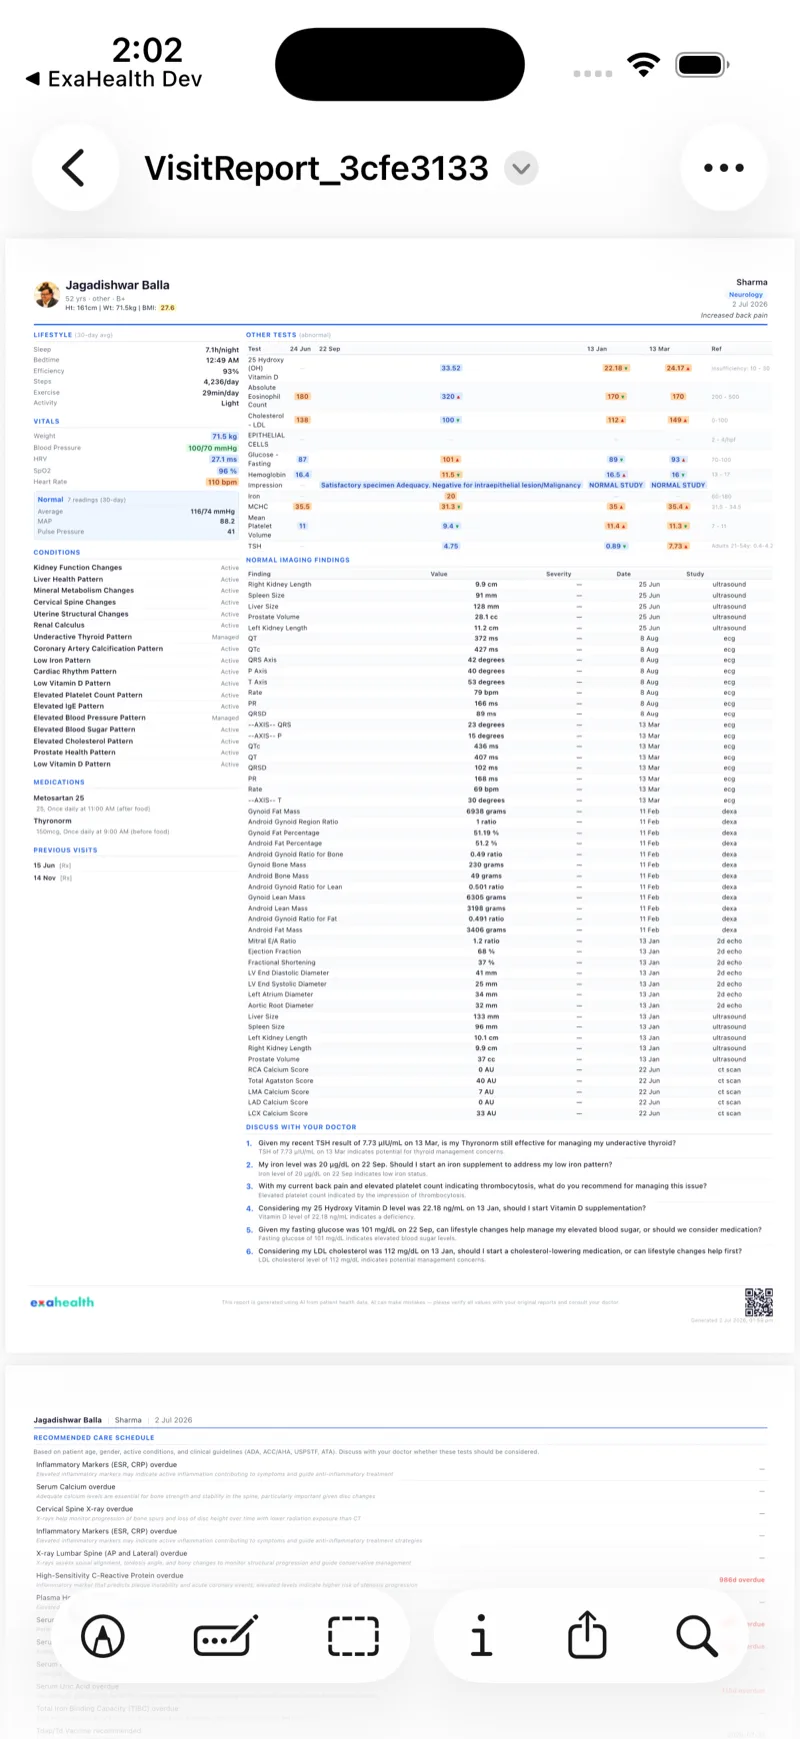
Walk in prepared
One report your doctor can read in a minute
Everything the engine knows — captured, connected and consolidated onto one page you can print or share. So the few minutes you get with your doctor go to decisions, not to digging through old files.
- Lifestyle, vitals & the 30-day picture
- Active & Managed conditions
- Every abnormal lab, trended over dates
- Imaging & ECG findings
- Current medications & schedule
- Questions to ask — generated for you
- A guideline-based recommended care schedule
- Printable PDF · shareable link
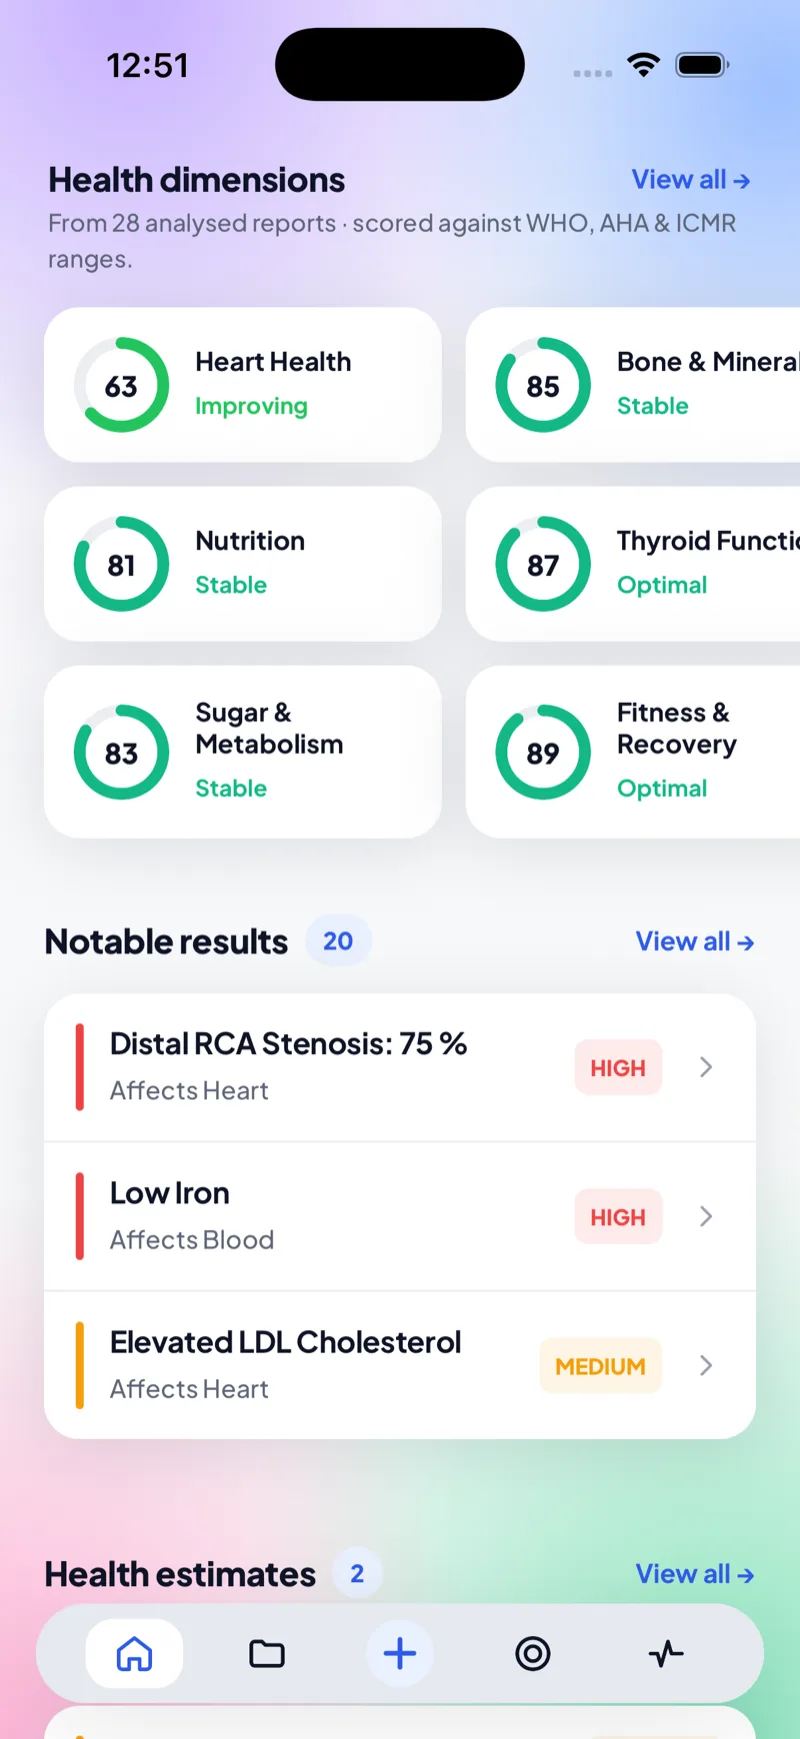
14 health dimensions
Every dimension, sourced
Each score is built from named markers and named guidelines — here's exactly what feeds what.
Heart Health
ACC/AHA 2018 · Framingham
LDL, HDL, ApoB, Lp(a), hs-CRP, BP, HRV
Metabolism
ADA 2024 · WHO
Glucose, HbA1c, Insulin, HOMA-IR
Liver Health
AASLD 2023 · FIB-4
ALT, AST, GGT, Bilirubin, Albumin
Kidney Function
KDIGO 2024 · CKD-EPI
Creatinine, eGFR, BUN, ACR
Thyroid
ATA 2016 · Endocrine Society
TSH, Free T4/T3, TPO Ab, TIRADs
Bone Health
FRAX® · NOF
Vitamin D, Calcium, PTH, DEXA
Blood Health
WHO Anemia · CDC
Hemoglobin, RBC, WBC, Platelets, SpO2
Inflammation
AHA/CDC CRP 2003
hs-CRP, ESR, IL-6, Ferritin, NLR
Hormones
Endocrine Society 2018 · AACE
Testosterone, Cortisol, Estradiol, FSH/LH
Nutrition
ICMR-NIN RDA 2020 · WHO
B12, Iron, Ferritin, Folate, Vitamin D
Brain & Cognition
AAN Practice Guidelines
Homocysteine, HRV, B12, REM sleep
Sleep Quality
AASM 2017
Duration, Deep/REM %, HRV, Cortisol
Fitness
ACSM Guidelines
Resting HR, HRV, VO2 Max, CK
Gut Health
ACG 2024 · ECCO
Calprotectin, H. Pylori, Amylase, Lipase
Every one of these markers has a plain-English guide. Explore the reference library →
Vitals & wearables
The same rigor for your live signals
Heart-rate variability, sleep, stress and recovery — computed with research-grade methods, from your watch or your phone camera.
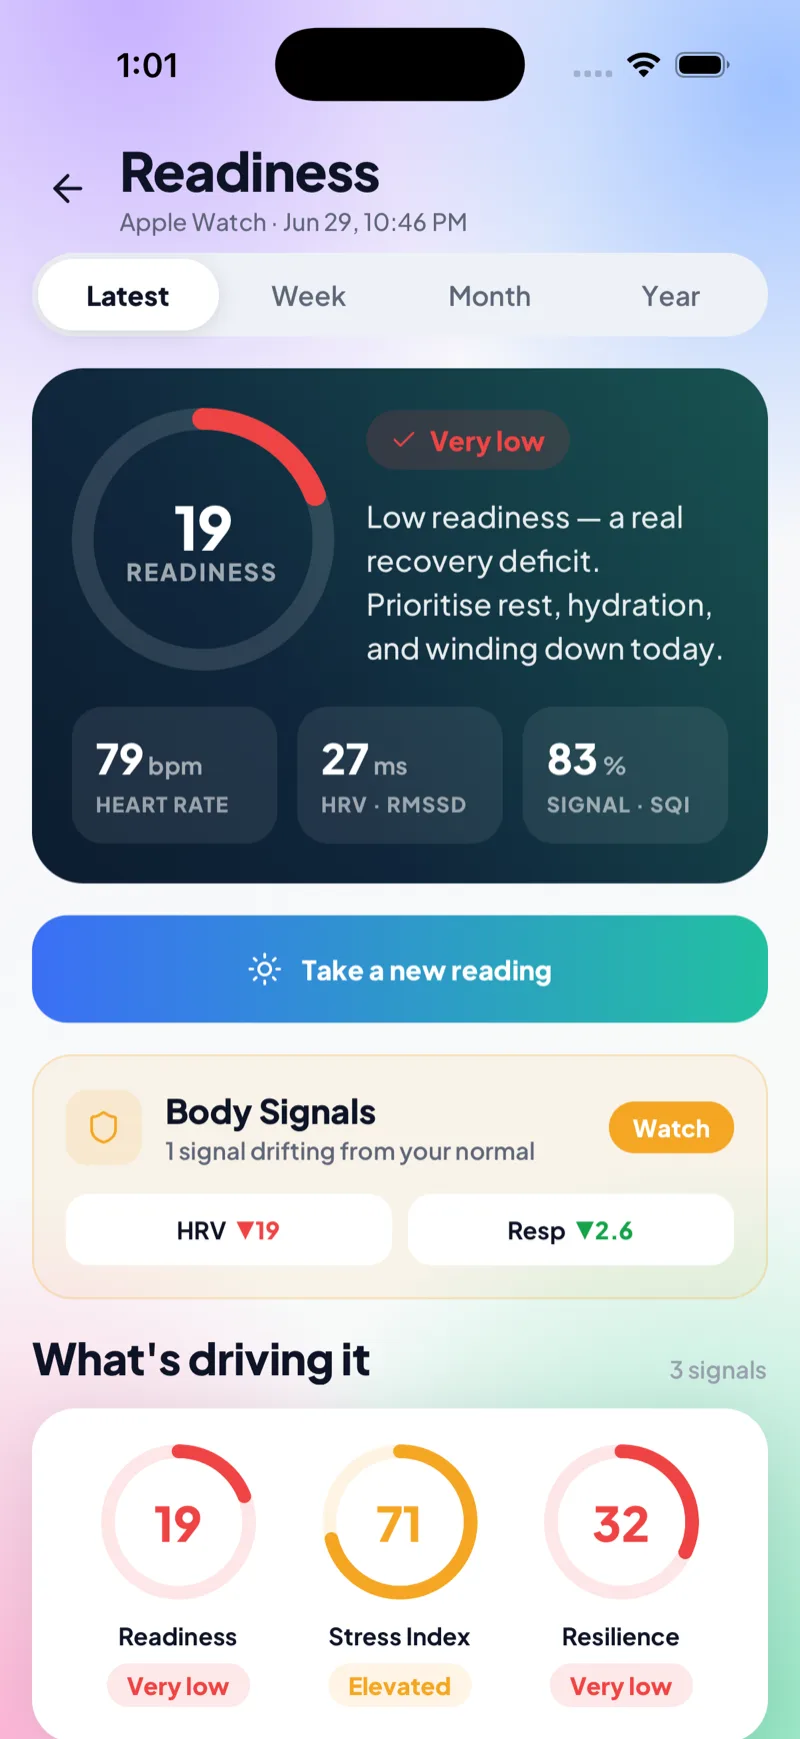
Readiness
RMSSD-based recovery with a signal-quality (SQI) score and drift from your own baseline — not a mystery number.
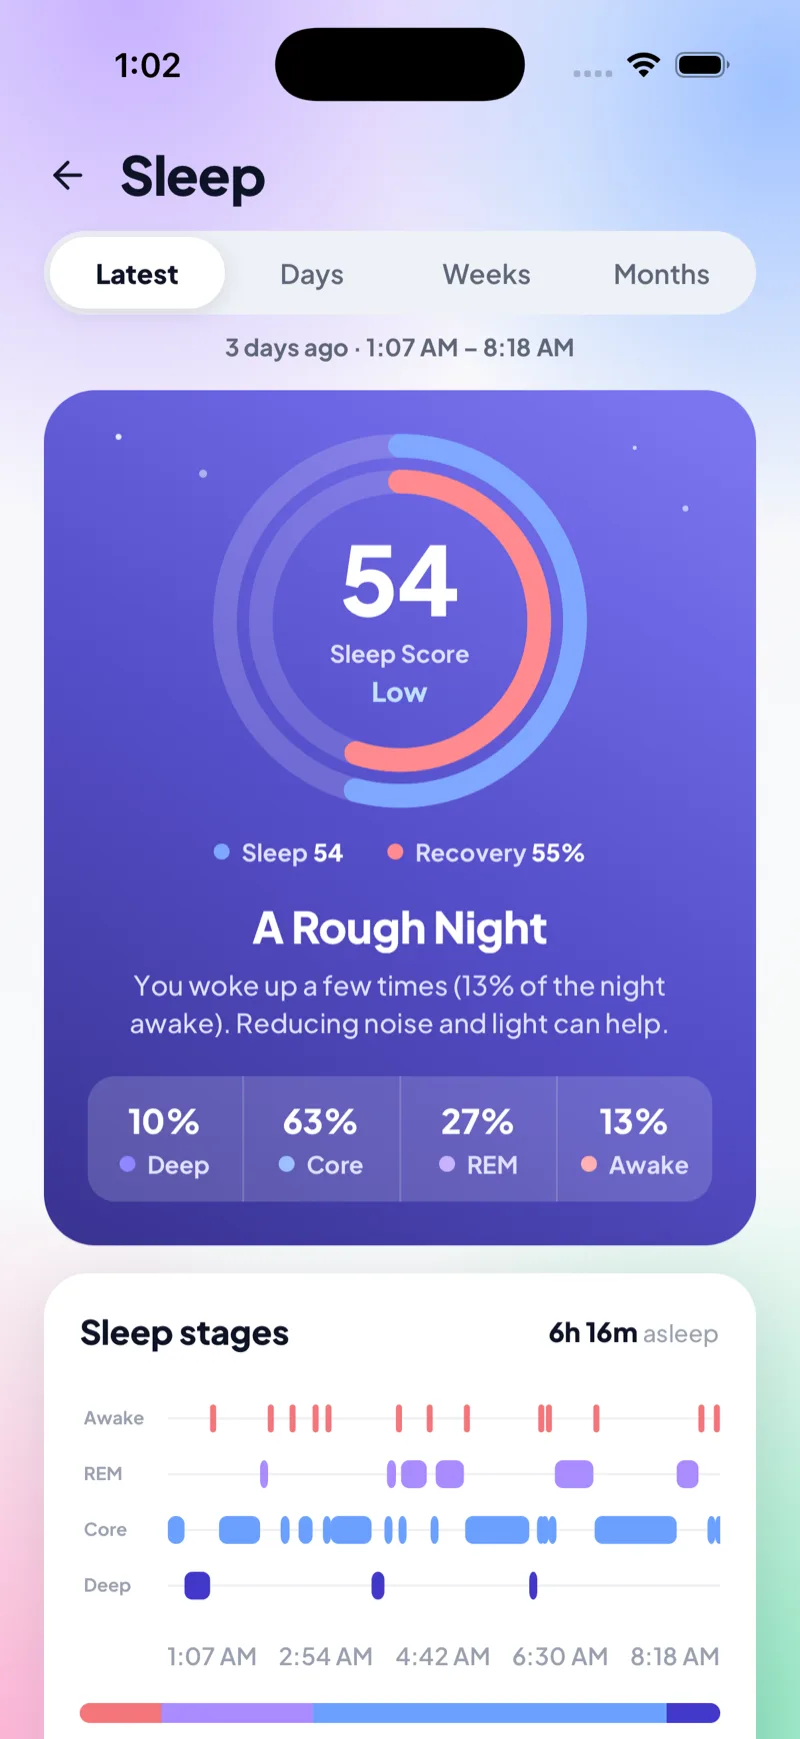
Sleep
Score, recovery and Deep/Core/REM/Awake stages read from a full hypnogram.
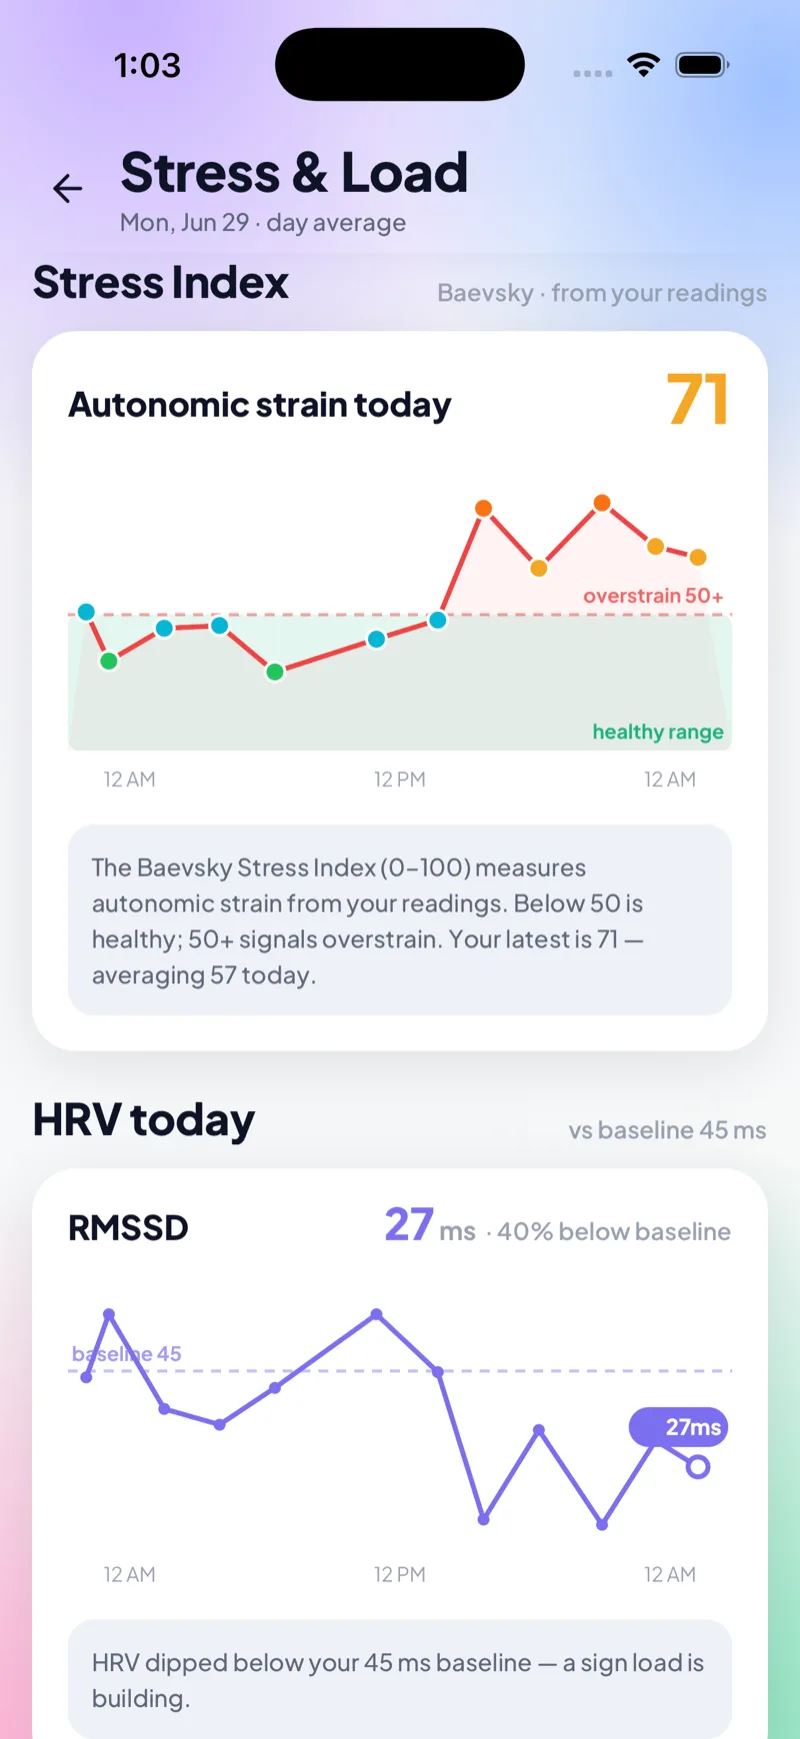
Stress & load
Autonomic strain via the Baevsky Stress Index, indexed to your 7-day baseline.
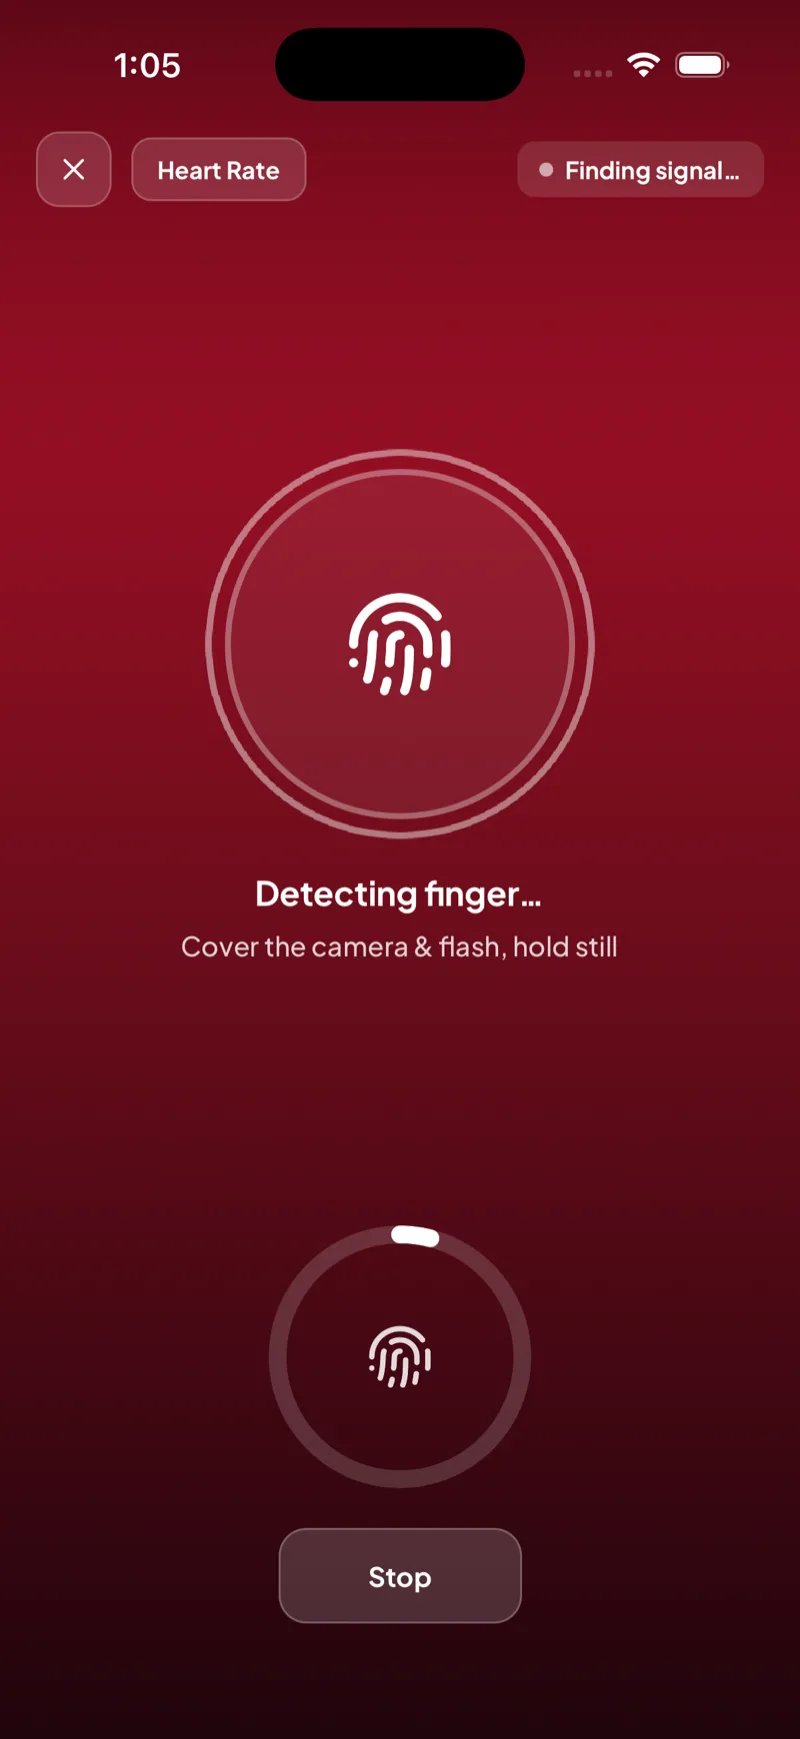
Camera HRV
Measure HRV straight from your phone camera when you don’t have a wearable.
…and every other vital, against your baseline
Published models
Built on research, shown working
HRV, the real way
RMSSD, SDNN, pNN50 and frequency-domain power (VLF/LF/HF) — the same metrics used in autonomic research, not a made-up wellness index.
Baevsky Stress Index
Our stress score is built on a validated measure of autonomic strain used in clinical and aerospace medicine for decades.
Biological age (PhenoAge)
Your biological-age estimate uses the published PhenoAge model over your actual blood biomarkers — every contributing marker shown.
Fail-closed severity
If we can’t classify a value safely — unknown unit, missing range — we say “no assessment” instead of guessing. Honesty over coverage.
 WHOWorld Health Organization
 AHAAmerican Heart Association
 ADAAmerican Diabetes Association
 ICMRIndian Council of Medical Research
 KDIGOKidney Disease: Improving Global Outcomes
 ATAAmerican Thyroid Association
Personalization
“Normal” depends on who you are
Reference ranges shift with life stage and conditions — ExaHealth adjusts instead of pretending one range fits all.
Pregnancy
Trimester-specific ranges — blood volume, hormones, glucose tolerance.
Menopause
Adjusted ranges for hormonal transition, cardiovascular risk, bone density.
Senior health
Age-appropriate ranges, kidney function and cognitive markers.
Thyroid conditions
Condition-specific TSH targets and related marker adjustments.
Diabetes care
HbA1c targets, kidney surveillance, cardiovascular protection.
Heart conditions
Intensified lipid targets, BP goals and inflammation monitoring.
For clinicians
Built to be shown to your doctor
Guideline-aligned
Reference ranges from ACC/AHA, ADA, KDIGO, ATA, ICMR and other authoritative sources.
Evidence-based
Severity classifications derived from meta-analyses and large cohort studies.
Longitudinal tracking
Trends over time reveal patterns and treatment responses, not just snapshots.
Comprehensive view
Labs, vitals and imaging unified in one shareable picture of the patient.
ExaHealth is educational. It explains, tracks and prepares — it does not diagnose, treat or prescribe. Scores and insights are decision-support for conversations with your healthcare provider, never a substitute for them. See our editorial & medical-review standards.
Your next report doesn't have to be confusing.
Start in your browser or on your phone — upload one report or connect your watch, and see your family's picture come together in minutes. The vault is free forever.